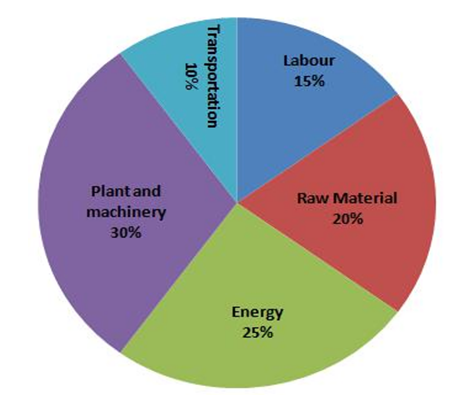
A firm producing air purifiers sold $200$ units in $2012$. The following pie chart presents the share of raw material, labour, energy, plant & machinery, and transportation costs in the total manufacturing cost of the firm in $2012$. The expenditure on labour in $2012$ is $Rs$. $4,50,000$. In $2013$, the raw material expenses increased by $30\%$ and all other expenses increased by $20\%$. What is the percentage increase in total cost for the company in $2013$?