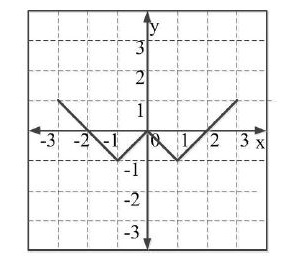
0 votes 0 votes Which of the following functions describe the graph shown in the below figure? $y=\mid \mid x \mid + 1 \mid -2$ $y=\mid \mid x \mid - 1 \mid -1$ $y=\mid \mid x \mid + 1 \mid -1$ $y=\mid \mid x - 1 \mid -1\mid$ Quantitative Aptitude gateme-2018-set1 numerical-ability absolute-value + – Arjun asked Feb 17, 2018 • recategorized Mar 5, 2021 by Lakshman Bhaiya ♦Arjun 28.5k points answer See all 0 reply